Reviewing US Markets in 2017 – The Year at a Glance
2017 was an excellent year for the United States equity markets, with the Dow Jones recording its second highest annual return for the decade (25.08%), with 11 positive months. Even with these stellar returns, volatility remained relatively low (5.97%) against a 10-year average of 14.2%.
Below are some of the events that defined the year along with key indicators of market performance:
Donald Trump sworn in as U.S. President
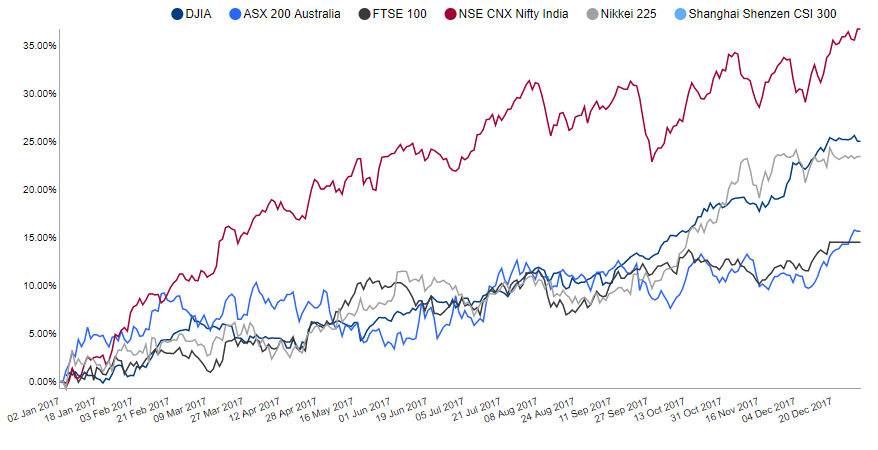
Donald Trump was sworn in as the 45th President of the United States in January 2017, and promised to reform taxation, healthcare and immigration policy. Despite a controversial start on many fronts, he was met with a positive sentiment by the market, with the Dow Index soaring 257 points the day after election day in November 2016. The graph below, highlights that the US equity markets outperformed most of the major global indices in 2017
Fig 1: Performance Graph of Indices in 2017
![]()
Massive tax reforms on the way
The end of 2017 also saw a massive tax reform bill passed by Congress and signed into law by President Trump – the bill proposes to introduce huge changes to the tax code and the healthcare sector.
The largest benefits have been for corporations with corporate income tax rate reduced dramatically to 21% from 35% previously. In addition, the corporate alternative minimum tax has also been repealed. For individuals, the changes have been incremental with a reduction of 2.5%-3% across various tax brackets.
Further, the bill repeals the federal fine imposed under Obamacare for not obtaining health insurance. The Congressional Budget Office (CBO) has estimated that this repeal will lead to 13 million fewer people who have health insurance by 2027.
This large cut in corporate tax rate will most likely have a favorable impact on GDP and equity market indices in the short term. However, the Trump administration’s GDP growth forecasts are very optimistic and experts agree that if they are not reached, this would lead to an increase in the federal debt by more than $1 trillion over the next 10 years due to lower than projected tax revenues.
North Korean nuclear tests unsettle financial markets worldwide
World indices underwent some shaky sessions due to escalating tensions between North Korea and the United States. For example, on 9th Aug 2017 the Dow Jones dropped by more than 1%, while the FTSE, DAX and CAC40 dropped by more than 0.5% amid concerns that tensions with North Korea would lead to a nuclear standoff and possibly war.
However, this has been beneficial for traditional savings havens like government bonds and gold. Matters have not improved in 2018, with Kim Jon Un threatened the United States with the size of his nuclear arsenal in his New Year’s address, and the US President responded in kind.
These events are expected to continue to have an adverse impact on financial markets in 2018 as well, and volatile market sessions with large fluctuations due to global uncertainties can be expected.
Fig 2: Daily Returns of Indices in August 2017

![]()
Macro-statistics improve from 2016
Macro indicators like GDP, inflation and non-farm payrolls in 2017 paint a better picture of growth compared to that of 2016. Though the rise in GDP has not been spectacular, the average annualized GDP growth rate of 2017(2.28%) has been better than that of 2016 (1.57%).
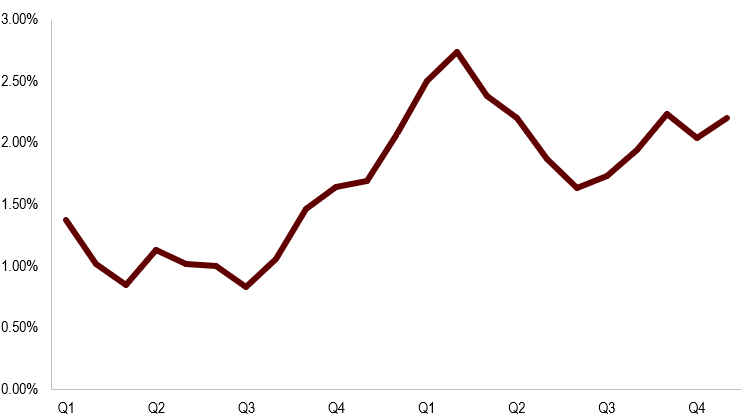
CPI Inflation continued its slow upward moment, as food prices were affected by the hurricanes which hit the United States in 2017. The Federal Reserve would like a consistent inflation target of 2% in 2018, to consider a rise in interest rates.
The unemployment rate reduced to 4.1% from 4.8% at the beginning of the year. Job gains occurred in health care, construction, and manufacturing. However, growth in wages has been low at 2.5%, over the same period.
The Federal Reserve Board faces a dilemma when considering an increase in interest rates – balancing the considerations of an inflation target on one hand and rising growth on the other. The interest rate stands at 1.5% at the end of 2017, post three hikes of 25 basis points during the year. However, most analysts forecast an increase in the benchmark interest rates in 2018 given the strong employment rates, asset valuations and global growth.
Fig 3: GDP growth of the U.S in 2017
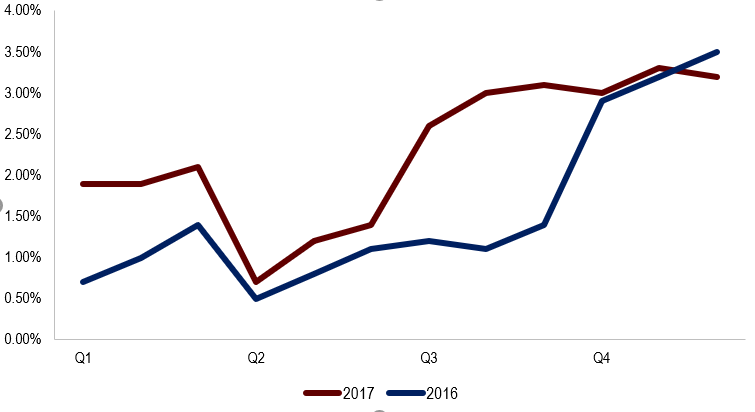
Fig 4: Unemployment rate of the U.S in 2017
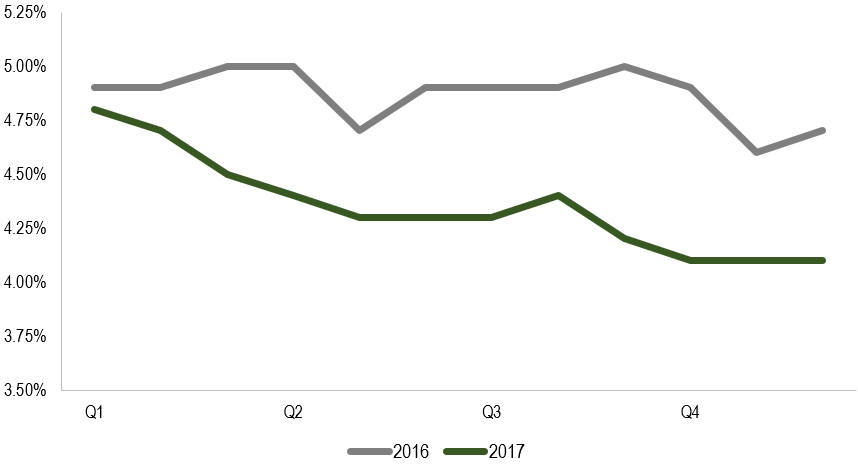
Fig 5: Annualized monthly inflation of the U.S from 2016-2017
2017 – The costliest U.S. disaster year
2017 saw the United States face a continuous onslaught of natural disasters – in the form of hurricanes, wildfires and other catastrophes. The disasters caused damage of more than $306 billion and resulted in the death of more than 200 people. Hurricane Harvey was the most expensive disaster with estimated losses of more than $125 billion. Hurricane Maria and Irma caused close to $100 million in damages.
The disasters in 2017 had a minimal impact on the CPI inflation (food prices increased) and slowed down the GDP growth during the 3rd quarter of the year. However, they are not predicted to have any lasting damage on the U.S. economy.
Insurers have a liability of more than $100 billion across the globe this year due to these natural disasters. This could have an impact on the value of Insurance-based ETFs in 2018.
The graph below depicts the drop in Insurance ETFs during the months of August and September (during Hurricane Harvey).
Fig 6: Daily returns – Insurance ETFs in Aug and Sept 2017

![]()
Crypto-currencies, healthcare and technology take a leap forward
2017 was a year to be remembered for a lot of fintech innovations – the HFR Cypto-currency index rose 3175 % in 2017 boosted primarily by gains in Bitcoin (1721% 1Y return), which rose from under $ 1000 in Jan 2017 to more than $14000 at the end of the year. The market capitalization of Bitcoin now stands at $240.72 billion.
Technology ETFs outperformed those of all other sectors – we have selected 3 of the top performers from 2017 in the graph below. They had an average annualized return close to 35% with an average Sharpe ratio of 2.6.
Fig 7: Performance graph – Technology ETFs in 2017

![]()
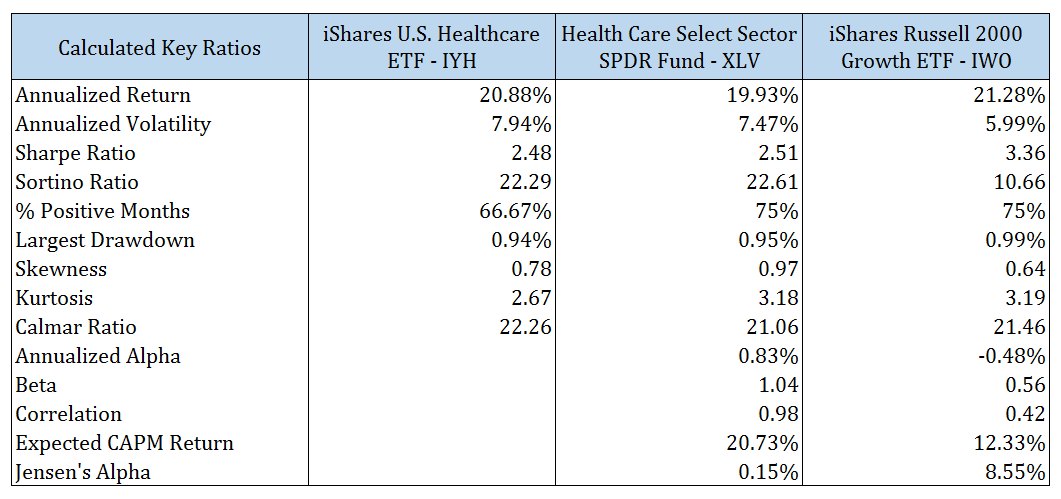
Talks about the repeal of Obamacare, have provided a boost to Healthcare ETFs. Though the sector fell out of favor after the Senate passed its tax reform bill, many analysts view the sector as undervalued and with strong fundamentals. The healthcare sector, along with the technology sector has been one of the best bets in 2017, due to Biotech and Pharma stocks.
Fig 8: Calculated key ratios – HealthCare ETFs
![]()
Outlook for 2018
2017 was an exceptional year for the Dow Jones Industrial Average which returned 25.08% against its 3-year average of 11.52% and decade average of 6.42%. Annualized volatility remained low at 6.6%. 2018 is expected to be a good year for the financial markets as well – however, there might be a slight correction due to overvaluation of the technology sector.
GDP growth of the United States is expected to remain at around 2-3%. 2017 saw oil prices at their highest in 2 years which gives a strong indicator that the manufacturing sector will raise its output. The tax cuts for corporates beginning in 2018 are expected to give a strong impetus to economic growth. If the inflation and growth targets are met, the Fed intends to raise the interest rates to 2.1% by the end of 2018.
The only blip on the horizon seems to be the current nuclear tensions between North Korea and the United States. Any escalation in the current situation would severely impact the world economy.
Overall, 2018 promises to be another good year for the U.S. markets with a special focus on Technology and Healthcare Stocks.
About the Author
 Sanjana is an Analyst in the India Innovation Lab at Risk Advisors Inc. in Mumbai. She focuses on client projects that require both an accounting background and statistical training, such as performance reporting and attribution.
Previously, she was an Assistant Manager in the Treasury department at Anand Rathi NBFC, a securities brokerage and asset manager based in Mumbai. At Anand Rathi, she was responsible for option pricing, securities valuation, asset-liability modeling, developing risk management strategies, and financial markets analysis.
Sanjana is a Chartered Accountant (equivalent to a US CPA) and holds a Bachelors in Commerce from Symbiosis College in Pune.
